Note
Go to the end to download the full example code.
Using DataPlusMeta files#
Read a matrix of efficiency measurements and associated meta data.
Copyright (c) 2019-2020 Anton Driesse, PV Performance Labs.
import numpy as np
import matplotlib.pyplot as plt
import matplotlib as mpl

from pvpltools.dataplusmeta import DataPlusMeta

mpl.style.use('classic')
obtain some matrix data
dpm = DataPlusMeta.from_txt('../data/CS5P-220M.txt')
name = dpm.meta['name']
mtx = dpm.data
# calculate the relative efficiency compared to stc
stc = mtx.query('irradiance == 1000 and temperature == 25').mean()
mtx['eta_rel'] = mtx.p_mp / mtx.irradiance * stc.irradiance / stc.p_mp
# create a pivot table for easy plotting
eta_rel = mtx.pivot(
index='irradiance', columns='temperature', values='eta_rel'
)
print(eta_rel)
print(eta_rel.T)
# plot vs irradiance
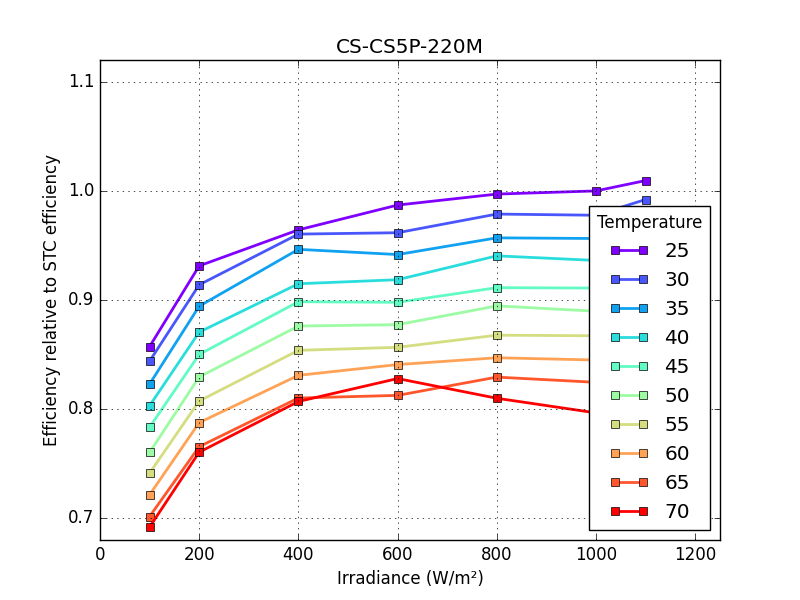
fig, ax = plt.subplots(1, 1, num=name + " Irradiance")
ax.set_prop_cycle("color",
plt.cm.rainbow(np.linspace(0, 1, len(eta_rel.columns))))
eta_rel.plot(style='s-', lw=2, ax=ax)
# make nice
plt.xlim(0, 1250)
plt.ylim(0.68, 1.12)
plt.grid()
plt.legend(loc='lower right', title='Temperature')
plt.title(name)
plt.xlabel('Irradiance (W/m²)')
plt.ylabel('Efficiency relative to STC efficiency')
# plt vs temperature
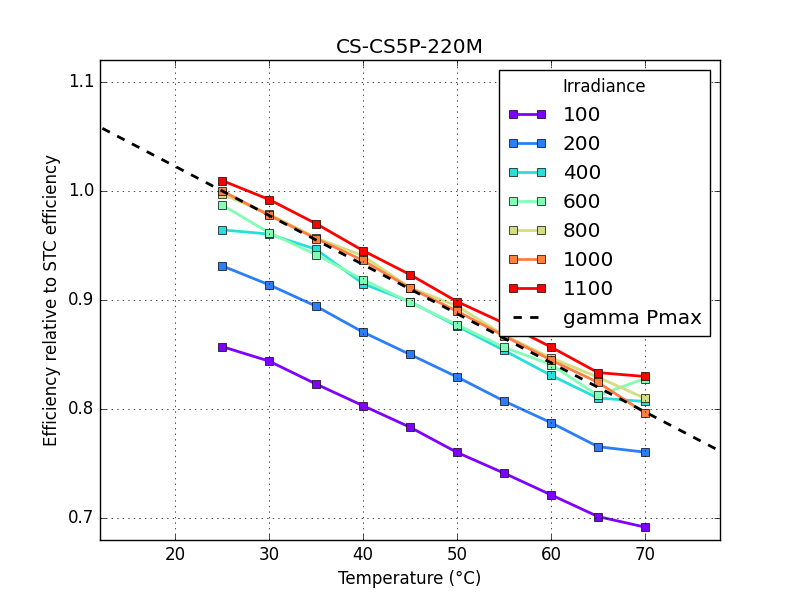
fig, ax = plt.subplots(1, 1, num=name + " Temperature")
ax.set_prop_cycle("color",
plt.cm.rainbow(np.linspace(0, 1, len(eta_rel.index))))
eta_rel.transpose().plot(style='s-', lw=2, ax=ax)
# add gamma
def gammafun(T):
return 1 + (T - 25) * dpm.meta['datasheet']['gamma_mp'] / 100
trange = np.array([0, 100])
ax.plot(trange, gammafun(trange), 'k--', lw=2, label='gamma Pmax')
# make nice
plt.xlim(12, 78)
plt.ylim(0.68, 1.12)
plt.grid()
plt.legend(loc='upper right', title='Irradiance')
plt.title(name)
plt.xlabel('Temperature (°C)')
plt.ylabel('Efficiency relative to STC efficiency')
/home/docs/checkouts/readthedocs.org/user_builds/pvpltools/envs/stable/lib/python3.12/site-packages/pvpltools/dataplusmeta.py:155: UserWarning: No dtypes in cdef.
  warn(message)
temperature        25        30        35  ...        60        65        70
irradiance                                 ...
100          0.857296  0.843970  0.822979  ...  0.721455  0.701533  0.691862
200          0.931300  0.913941  0.894331  ...  0.787592  0.765554  0.760518
400          0.964302  0.960413  0.946430  ...  0.830934  0.810155  0.806968
600          0.987024  0.961665  0.941661  ...  0.840806  0.812558  0.827985
800          0.997086  0.978775  0.956970  ...  0.847062  0.829319  0.809932
1000         1.000000  0.977690  0.956369  ...  0.844959  0.824534  0.796533
1100         1.009493  0.992112  0.969970  ...  0.856915  0.833468  0.829883

[7 rows x 10 columns]
irradiance       100       200       400   ...      800       1000      1100
temperature                                ...
25           0.857296  0.931300  0.964302  ...  0.997086  1.000000  1.009493
30           0.843970  0.913941  0.960413  ...  0.978775  0.977690  0.992112
35           0.822979  0.894331  0.946430  ...  0.956970  0.956369  0.969970
40           0.803102  0.870532  0.914888  ...  0.940469  0.936251  0.945255
45           0.783403  0.850120  0.898420  ...  0.911294  0.910955  0.923284
50           0.760317  0.829508  0.876125  ...  0.894587  0.889701  0.898573
55           0.741332  0.807425  0.853875  ...  0.867747  0.867199  0.878773
60           0.721455  0.787592  0.830934  ...  0.847062  0.844959  0.856915
65           0.701533  0.765554  0.810155  ...  0.829319  0.824534  0.833468
70           0.691862  0.760518  0.806968  ...  0.809932  0.796533  0.829883

[10 rows x 7 columns]

Text(61.0, 0.5, 'Efficiency relative to STC efficiency')
Total running time of the script: (0 minutes 0.244 seconds)